Consumer-Centric Approach: The OPIS vision for the future of retail fuel pricing
Published on: Mar 13, 2025
Advertorial
Fuel retailers in the United States, Europe and in most developed countries throughout the world have entered a new era.
Declining fuel demand is clearly the new normal. In growing economies with growing populations, increasing the volumes sold at fuel retail stations was traditionally an easy proposition through the mid-late 2010’s. A multitude of reasons have accelerated the subsequent change as the COVID-19 pandemic, better fuel economy, increased rates of remote work, and the higher prevalence of electric vehicles have driven down fuel consumption. For most of the developed world, gasoline demand is on a downward trajectory.
According to OPIS DemandPro, the last “normal” year to see same-store gasoline demand growth in the US was 2015, with just a slight 0.1% upturn from 2014. 2021 saw a jump of 4.6% over 2020 demand, thanks to the unprecedented post-pandemic recovery. From 2016 through 2020, as well as every year since 2021, same-store gasoline demand has been on a slow and steady decline.
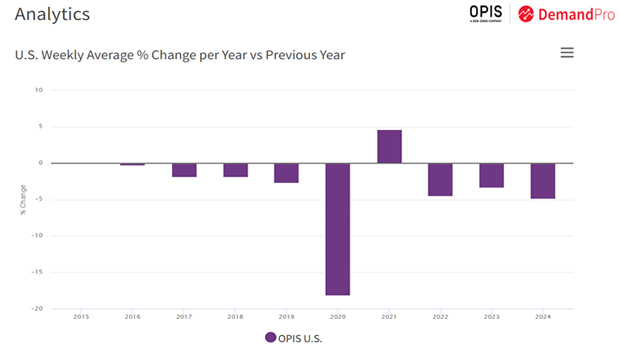

Continued annual declines have made it increasingly clear that same-store volumes are not bouncing back. Fuel retailers can no longer count on rising fuel demand to deliver growth.
Higher Margins Help, but for How Long?
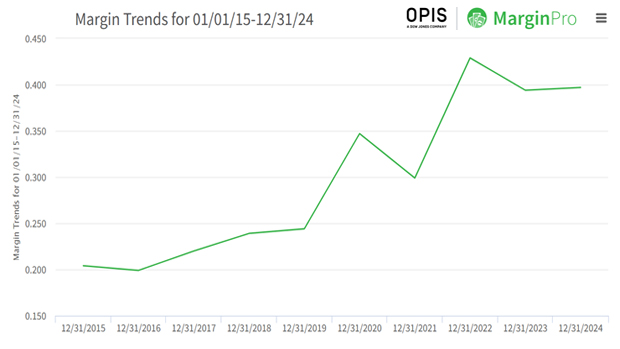
OPIS data shows that because of the decline in volumes being sold at fuel stations, there has been an increase in margin. This highlights the need to adjust strategies to cover operating expenses and keep the lights on at their stations.
Recent history suggests much more reticence to lower price offerings to capture volumes and market share. A comparison of pre-pandemic profits and post-pandemic returns is quite compelling. Smaller operators appear to need broader margins and marketers with scale recognize this “sea change” in marketing. The Big Box chains still stand out as price leaders, but they have found that undercutting retail offerings by 20cts/gal enables them to collect robust fuel margins across their systems.
In the U.S., 2024 margins hovered very close to 40cts/gal. So far in 2025, returns have been about a nickel lower, but midwinter often presents a hostile environment for margins and overall sales. When viewed as a comparison with pre-pandemic levels, however, fuel margins are much more substantial than in the previous decade.
Whether fuel margins remain robust or shrink back to historical lower levels, market conditions force fuel marketers to focus on maintaining a loyal customer base and maximizing market share. Retailers can do so only if they have the best data and insight about their existing locations.
A Less-Effective Hammer
Growing your retail fuel and convenience business used to be relatively straight forward. More aggressive pricing equated to higher fuel sales, and higher fuel volumes meant more in-store trips for patrons stopping for gas. Traditionally fuel prices have been the retailers’ hammer, but the toolkit for marketers has been altered by the slow but steady attrition in fuel consumption and they don’t have to just rely on prices as the only means to maximize profits.
Many successful fuel retailers would rely in the past on consistent brand positioning, with a clear view of customer perception of the fuel offering. There were always value-driven brands; premium quality brands; a clean and hospitable store experience and other considerations. Regardless of the choice, consistency was the key for retailers maintaining their position in a given market. That facet shouldn’t change with declining volumes, but it puts more pressure on a thoughtful pricing strategy that supports the business plan.
The more-sophisticated fuel retailers have already made the switch from focusing on volumes to focusing on market share. You can increase your market share, capturing volumes that would have been sold at competitor stations for your own locations, while still experiencing overall lower sales on fuel products, meaning that you outperform the market by not declining as rapidly as the industry average.
The Pie is Shrinking, but Your Slice Can Still Get Bigger
Shifting from a focus on maximum volume to a focus on market share may be new to some fuel retailers, but many savvy marketers are moving in this direction.
Indeed, there are multiple paths toward increasing a retailer’s market share. An obvious way might be through growth, whether it’s organic growth tied to new builds, expansion into new markets, or some dabbling in M&A. Increasing your store count is an obvious way to increase your sales if you have the required capital. However, it’s a quixotic task if operations aren’t maximized at each and every location, whether it’s a new build or an acquired site.
Measuring success in this endeavor is impossible without the right data and metrics. Past history saw some retailers rely on simple car-counting methods or meter reading, but that does nothing more than capture a point-in-time analysis and hardly yields a complete picture. Plus, those methods are expensive and painstaking, taxing labor and systems.
Today, more reliable metrics are available in the market. For example, OPIS now offers market share metrics calculated using cell phone ping data, or “visits.” Our analysis of this methodology indicates a correlation of 0.87 between the visit counts market share data and actual same-store volumes. While not perfect, this reflects an extremely high correlation between unrelated data sets and works as a proxy for gauging your market share, whether as a brand at a regional level or all the way down to the site level.
Another key metric is understanding each of your store’s actual competitive footprint. Where are my customers coming from, and what do they look like demographically? Where are my competitors’ customers coming from and how do they differ from my typical customer? And maybe most importantly, what competitive stations do I need to worry about and monitor?
Without data, you don’t really know who your competitors are, and they are not necessarily the ones closest to your stations. If you’re attempting to capture market share from a competing station but their customers are unlikely to ever stop at your store, you’re fighting a losing battle. Sure, it’s very likely that the two or three closest stations to your location represent competition, but that ignores sites that might be more distant but lure your patrons. Ignoring competitors represents a huge risk to retailers that gets amplified in a declining volume environment.
Once you understand your market, you then must find opportunities to capture market share and/or to optimize margins at the best possible times, all while keeping your brand value consistent to the marketplace. It’s imperative that you understand when and where to capitalize on “micro-opportunities” to increase profitability and maintain your brand’s position in the market.
Finding Your Opportunities and Capitalizing with Sophisticated Execution
Keeping your brand image consistent to consumers is critical, but that doesn’t mean that a fuel pricing strategy must be set in stone. Every station has a level of elasticity, with varying price sensitivities that may determine whether share is gained or lost. Some sites may lose share by being just a cent or two higher than local competition while others may be more resilient when other sites go low.
It's relatively easy to measure elasticity overall. When I price higher than typical, do my volumes suffer? Or do they remain consistent even when I price more aggressively? Typically, retailers have measured this at a macro level for their stations, looking at a longer-term trend for how elastic a location is.
But in reality, elasticity is an ever-changing phenomenon. A store can be more elastic on a weekend than on a weekday. Some stores may be highly elastic in the mornings but completely inelastic in the evenings. Moving forward, OPIS believes it’s the fuel retailers that capture this information and act on these nuances who will have the most success long term.
Execution can be tricky. For many fuel retailers, changing the price frequently at their locations to capitalize on opportunities requires manual intervention that burdens store managers who might otherwise be overworked.
The simplest option is to make an investment in the right technology. Systems that can execute two, three, or even more price changes per day and keep clients happy are now readily available.
The AI Boogeyman
Rather than dedicating significant time and staff to manually analyze data, identify opportunities, and adjust prices, marketers can leverage AI to handle these tasks far more efficiently and cost-effectively. AI, particularly machine learning, is a tool that can be employed to help you identify these opportunities, and in some cases help execute a pricing strategy to drive market share and profitability at stores.
There are many misconceptions around AI and what it means for traditional retail businesses. It might seem scary to consider letting “a machine” price stores without the accrued and inherent knowledge that comes from years of experience and hands-on management.
Employing machine learning is a valid concern that conjures a red flag. Left unchecked, AI could result in inconsistent pricing behavior. That’s why trusted guard rails are needed in the form of your existing fuel pricing team.
The key to making AI work for you is to provide systems with the data necessary to make the best pricing recommendations possible, and to employ people to validate the strategy before implementation. Human oversight is critical to ensure transparency, accountability and compliance. AI can be a way to accomplish the millions of calculations required to understand micro-elasticity at your stations by day of week and time of day without a massive increase in head count, and will help your fuel pricing analysts today by empowering them with the data and tools they need to execute a sophisticated fuel pricing strategy, increasing profits and ensuring your business’s long-term success.
The OPIS Acquisition of A2i
OPIS has the world class data that any AI algorithm will need to be truly effective, but our vision has always been more ambitious. Last July we took a major step in ushering in the future of fuel pricing for our customers by acquiring A2i Systems.
OPIS has always viewed A2i’s PriceCast tool as the world’s best AI-driven fuel pricing algorithm. A2i looks at a client’s own transactional data to identify the opportunities that drive market share and profits to a fuel station. And they’ve had great success, achieving a 100% renewal rate with clients and a 100% success rate from proof of concept to signing.
What excites us at OPIS is what A2i will be able to accomplish when coupled with OPIS data. Whether it’s our live stream of fuel pricing data, or our weekly stream of site-level analytics based on visit counts and customer behavior, we believe that the combination of OPIS data and A2i’s algorithm will help retailers achieve world class results.
Ultimately, unlike traditional competitor-centric systems, PriceCast utilizes historical and real-time transaction data to predict customer demand and recommend prices tailored to localized conditions. Factors like weather, traffic, and demand elasticity inform these recommendations, creating a customer-centric approach rather than one that merely reacts to competitor behavior.
Whether going with a solution like OPIS and A2i or another tool in the market place, one thing is crystal clear: AI can help your existing fuel pricing team operate at a level of efficiency never achieved before and help your business grow.
Keep that fuel pricing “hammer” in your tool belt handy because you will always need it. But you may need a tool belt with a few more loops to hold all the tools that the most successful fuel retailers will need to thrive in a more challenging environment.
Learn more with OPIS and A2i Systems!


